Put all your eggs in one basket: Diversification
Without risks, no returns. But if you diversify, you can get the maximum return with as little risk as possible.
Hold all your assets in a single stock and watch it go up and up and up! If you want to become really rich, you might think, you put all your eggs in one basket. A few people have done that and we hear their stories over and over again in the media, just think of Mark Zuckerberg or Bill Gates.
Unfortunately, only very few people are successful in this way. The stories of all those who failed with this strategy are never told. And those who have made a fortune this way sooner or later rely on a second card: Diversification.
Diversification is a wonderful way to achieve as much return as possible with as little risk as possible. This effect is probably the only free lunch in the stock market. The basic principle of diversification is: Don't put all your eggs in one basket.
Do not invest your assets in just one share, but in a portfolio with many different investments – a mix, not only spread over shares, but also over other asset classes. We show you here exactly how this works and what you need to do to achieve it.
Avoid Unsystematic Risk
Modern portfolio theory distinguishes between two types of risk: "systematic" and "unsystematic" risk. Unsystematic risk can be avoided through diversification, while systematic risk remains. Therefore, in the long run, there is only a market premium for systematic risk.
An example of unsystematic risk is a single share. Still remember Enron? Or Swissair? The American energy giant went under in 2001 because of fraudulent accounting. The Swiss flagship airline failed because of its overstretched expansion plans. Who can guarantee that Apple and Google will fare better until the end of our days?
Unsystematic risk can also be found in a portfolio that only invests in a single sector. With oil prices a third below their highs in May 2018, oil company share prices are also suffering. Shares in banks have never reached again the highs of 2007. Technology companies, on the other hand, as measured by the Nasdaq 100, have done extremely well since the lows of 2009. But do you know how long this will last?
Compensation for Systematic Risk
But isn’t risk necessary? As the saying goes: The higher the risk, the higher the return. A really good ratio between risk and return is actually only possible after avoiding unsystematic risks. What remains is the systematic risk. This is the risk you want to take. This risk offers the best return. This is basically a combination of global economic growth and interest rate risk.
By taking on systematic risk, you participate in the growth of the economy as a whole, all over the world. So you participate in companies – not just in one industry, but in all industries, in all countries. You also participate in the raw materials they need for their production. And in the development of the bonds with which companies and countries finance themselves.
Diversification in Practice
So much for the theory. But how does it work in practice? Let's look at how diversification improves a portfolio step by step.
First, we need to briefly define how we want to measure risk and return. We measure return in percent per year (annualised over all years of the period under consideration). Risk is measured in standard deviation (a statistical measure of how much lower or higher returns have been than their mean. Or, in short, a measure of how much the results fluctuate around the mean).
For our example, we build a diversified portfolio from individual asset classes in five steps. And after each step, we look at how well risk and return compare.
Let's first compare portfolios number 1 and 2. Portfolio 1 is – from a diversification point of view – actually not a portfolio at all. It contains only one asset class: Swiss equities. In the eighteen years between the end of 1999 and the end of 2017, these – measured by the SMI Gross Total Return index – produced a return of 3.83 per cent annually with a risk of 13.8 per cent.
Portfolio 2 contains – equally undiversified – only shares from emerging markets. The end result – measured by the MSCI Daily TR Net Emerging Markets – is only better in terms of return than in Portfolio 1: This was 4.50 per cent annually. However, the risk was also significantly higher at 21.1 per cent.
Let us now take the first step towards a diversified portfolio: We mix the two asset classes. This creates portfolio number 3, with half shares from Switzerland and half from emerging markets.
The result is astonishing: The return has risen to 4.52 per cent – better than the emerging markets alone. At the same time, the risk has fallen: To only 15.8 per cent, just a little more than Swiss equities alone.
A simple stock mix: Slightly better results with much less fluctuations
Note that we are comparing apples and oranges here: Not only are we comparing the performance of one asset class with that of another. We are also comparing the ingredients alone with their mix in a fruit salad.
Better Results with Bonds
Does the mixed recipe get even better if we not only diversify between equities in the fruit salad, but also add a completely different asset class as a further ingredient? Let's see what happens if we add 40 per cent bonds to the pure equity mix from portfolio 3.
On their own (see Portfolio 4), bonds – as measured by the SBI Dom Gov index – were, as expected, moderately profitable at 3.68 per cent and moderately risky at 4.0 per cent volatility.
However, if we mix bonds with our previous equity mix from portfolio 3, the best portfolio in our comparison emerges in portfolio number 5: With 4.57 per cent, it is even higher-yielding than the pure equity mix from number 3. And it achieves this yield with a much lower risk of only 9.2 per cent – a full third less fluctuation in value.
Even better with bonds: More return with significantly less fluctuations
And if You mix Portfolios Yourself?
We have calculated the examples for this article from our own sources (Bloomberg). Of course, we have chosen periods and asset classes that show the benefits of diversification particularly well – step by step.
However, you will also discover similarly good results if you mix portfolios yourself. This can be done very easily with a wonderful online tool: The Portfolio Visualizer. It is tailored to the American market and unfortunately it does not show many Swiss examples. But the tool is so simple that you can play with it yourself without much prior knowledge and test your own ideas for portfolios.
Whether you want to mix more portfolios yourself or are satisfied with the examples in this article, you will always discover the same thing: Almost any mix of investments is better than any single investment. In other words: Any diversification is better than no diversification. Because everything never works out well at the same time. But something always works.
Professional Mixing follows the Efficient Frontier
By itself, diversification helps – if you do it at all. But with the right recipe you can achieve much more. For every combination of different investments, there are certain mixing ratios optimally balancing risk and return. They form the recipes for the best possible portfolios. All these recipes lie on a curve that usually looks like a part of an ellipse. Modern portfolio theory calls this curve the "efficient frontier".
On the efficient frontier you can read how much return you could have expected for the amount of risk you took on. (Unfortunately, as with all statistics, you can only see this for the past and not for the future).
For the future, you can still make a good estimate on this basis as to whether a little more risk would be worthwhile, for example, because it would have yielded proportionately much more returns. You can also estimate how much return you can expect if you don't want to exceed a certain level of risk. (And if you want: You can also play through the combinations on the Efficient Frontier yourself in the Portfolio Visualizer).
How does Your Ideal Portfolio look like?
How much risk can and do you want to bear with your assets? This question should always be asked at the beginning of your investment. If you know the answer, you can determine the optimal portfolio mix for your risk level – with which you can achieve the maximum return for precisely this level of risk.
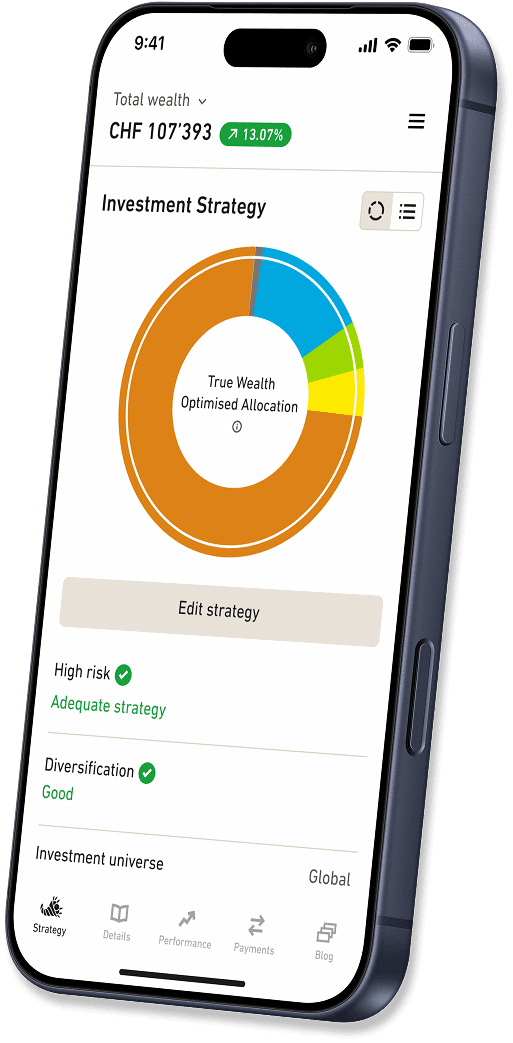
You can take both steps yourself. Or you let us accompany you: Open an account with True Wealth and we will assess your risk tolerance based on a few simple questions. We then automatically construct the most efficient portfolio for you. It is simple, completely transparent and extremely cost-effective to implement. (And if you simply want to try it out without any obligation: With a virtual test account, it is also completely free).
Link
About the author

Founder and CEO of True Wealth. After graduating from the Swiss Federal Institute of Technology (ETH) as a physicist, Felix first spent several years in Swiss industry and then four years with a major reinsurance company in portfolio management and risk modeling.
Ready to invest?
Open accountNot sure how to start? Open a test account and upgrade to a full account later.
Open test account